
Guernsey property prices return to growth with 4.1% annual rise

- Average property purchase price reached £604,094 in Q1 2026, up 4.1% annually and 18.5% over five years, marking a return to growth after declines in 2024–2025
- Time to sale extended to 284 days average, up 37 days year-on-year, whilst the gap between asking and achieved prices widened to 8.4% from 3.0% in 2021
- 163 Local Market transactions completed in Q1 2026, with properties between £300,000–£699,999 accounting for 64% of sales
- Average rental prices reached £2,170 per month, rising 4.9% annually and 44.9% over five years, outpacing general inflation
- Island's housing stock grew by net 45 units in Q1 2026, with 112 units added over the past year through new builds, subdivisions and conversions
Guernsey's residential property market has returned to growth in the first quarter of 2026 after a prolonged period of decline, with average purchase prices rising 4.1% annually and transaction times lengthening, according to the latest official bulletin.
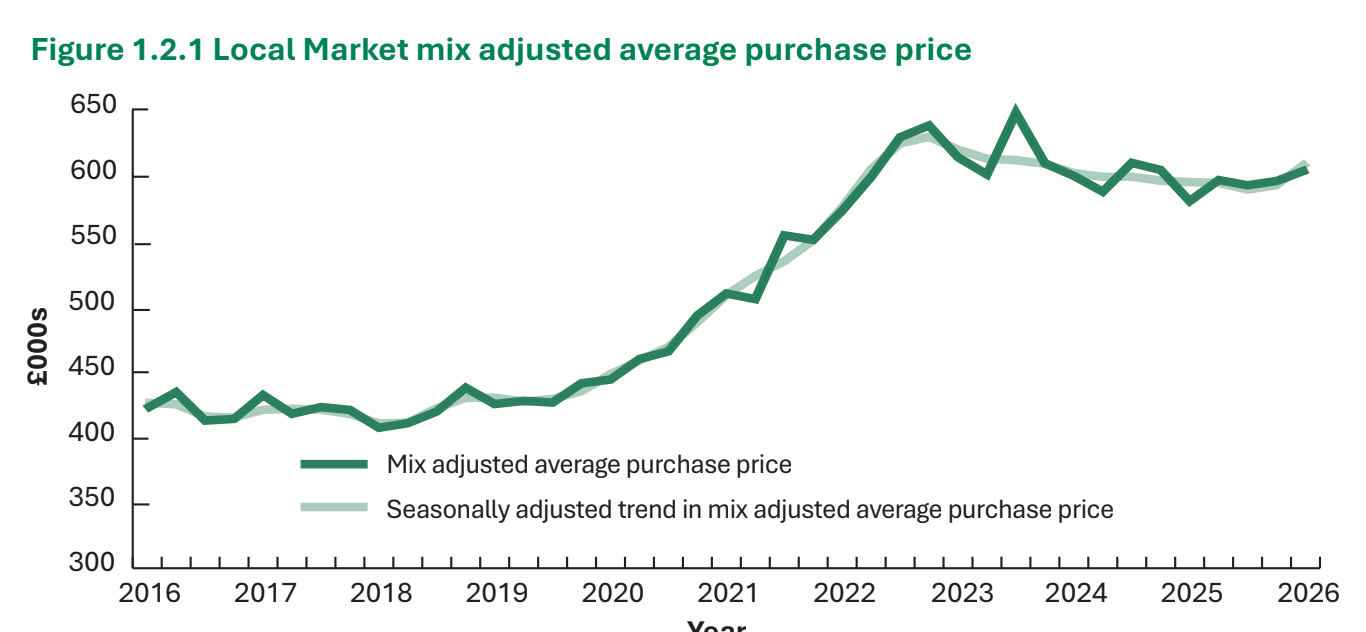
The mix-adjusted average purchase price for Local Market properties reached £604,094 in Q1 2026, representing a 1.4% quarterly increase and marking a turnaround from the declining prices seen throughout much of 2024 and 2025.
The Data and Analysis team at the States of Guernsey published the findings in the Guernsey Quarterly Residential Property Prices Bulletin.
Over a five-year period, Local Market purchase prices have increased by 18.5%, from approximately £509,906 in Q1 2021 to the current level.
The first quarter recorded 163 Local Market transactions, representing 83 fewer sales than the previous quarter but only three fewer than the same period in 2025. The £300,000–£499,999 and £500,000–£699,999 price segments each accounted for 52 transactions, or 32% each, representing the largest portions of market activity.
Properties priced under £300,000 accounted for 10 transactions (6%), whilst those between £700,000–£899,999 represented 35 sales (21%), and properties over £899,999 comprised 14 transactions (9%).
Several indicators suggest a cooling property market compared to previous years. The four-quarter rolling average time between a Local Market property becoming available for purchase and its subsequent sale extended to 284 days for properties purchased in Q1 2026, compared with 251 days in Q1 2025 and just 207 days in Q1 2021. This represents a 37-day increase year-on-year and a 77-day increase over five years.
The difference between maximum advertised prices and final sale prices averaged 8.4% in Q1 2026, slightly improved from 8.7% a year earlier but significantly higher than the 3.0% discount seen in Q1 2021. This substantial widening of the gap between asking and achieved prices indicates reduced buyer urgency and increased negotiating power for purchasers.
New build properties represented 6.7% of Local Market purchases during Q1 2026, up from 4.8% in Q1 2025 and 2.9% in Q1 2021, suggesting growing completion and sale of newly constructed properties.
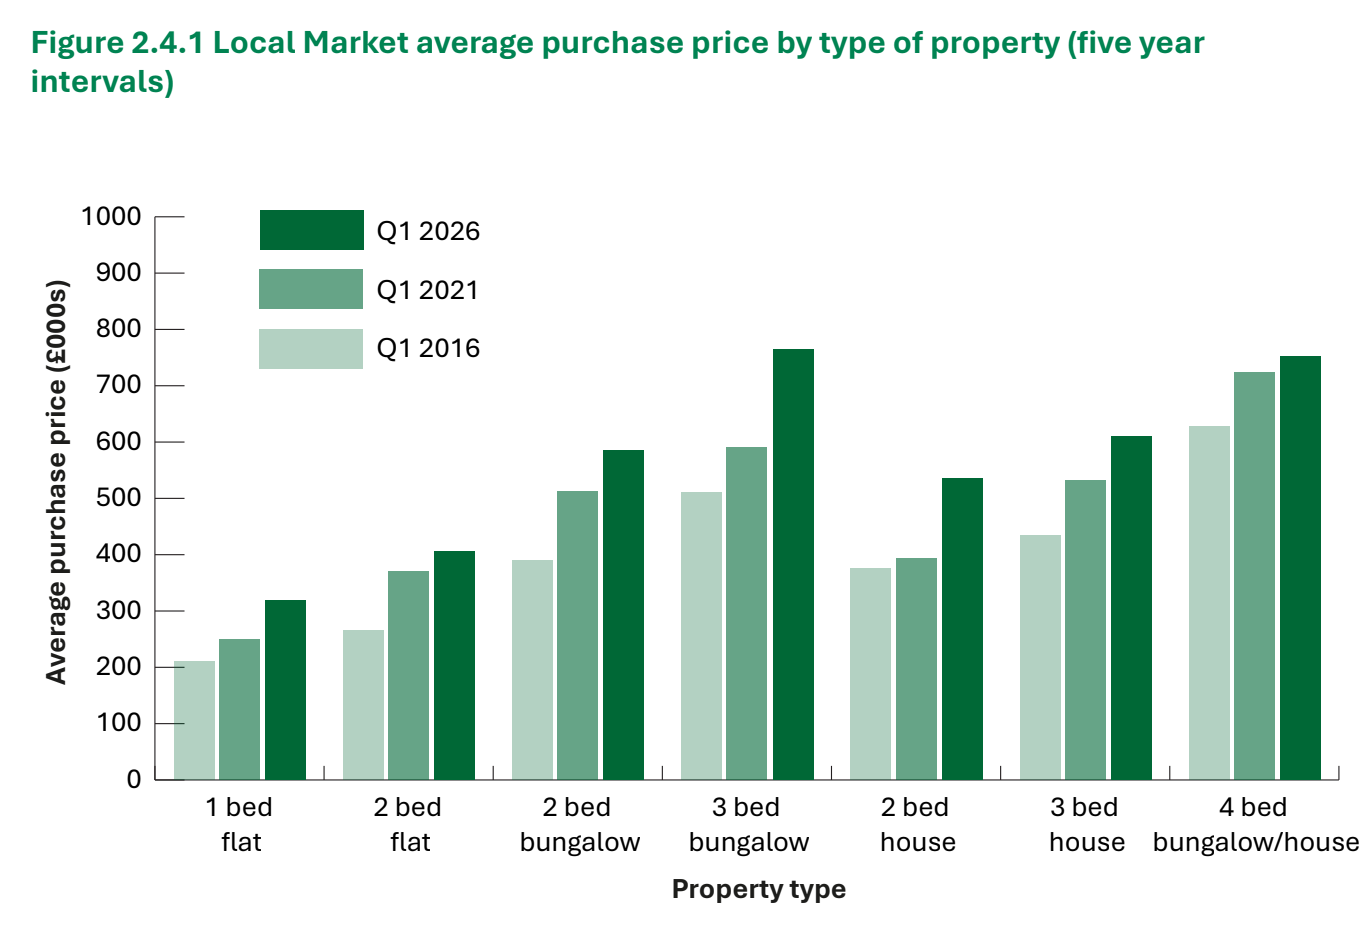
The property type breakdown for Q1 2026 showed three-bedroom houses and three-bedroom bungalows as the most frequently transacted categories, each representing 18% of sales.
Two-bedroom apartments accounted for 15% of transactions, whilst one-bedroom apartments comprised 13%.
Two-bedroom houses made up 9% of sales, whilst four-bedroom houses and bungalows combined represented 12%.
The median loan-to-value ratio stood at 76% in Q1 2026, down slightly from 79% in both Q2 and Q3 2025 but similar to the 75% recorded in Q1 2025. Since data collection began in 2009, average loan-to-value ratios have fluctuated within a 15% range, with a historic high of 85% recorded in Q2 2019 and a low of 70% in Q4 2010.
The total value of bonds issued for Local Market residential purchases in Q1 2026 was £49 million, down from £79 million in Q4 2025 and £50 million in Q1 2025. The total value of Local Market conveyances was £100 million in Q1 2026, compared to £161 million in Q4 2025 and £103 million in Q1 2025.
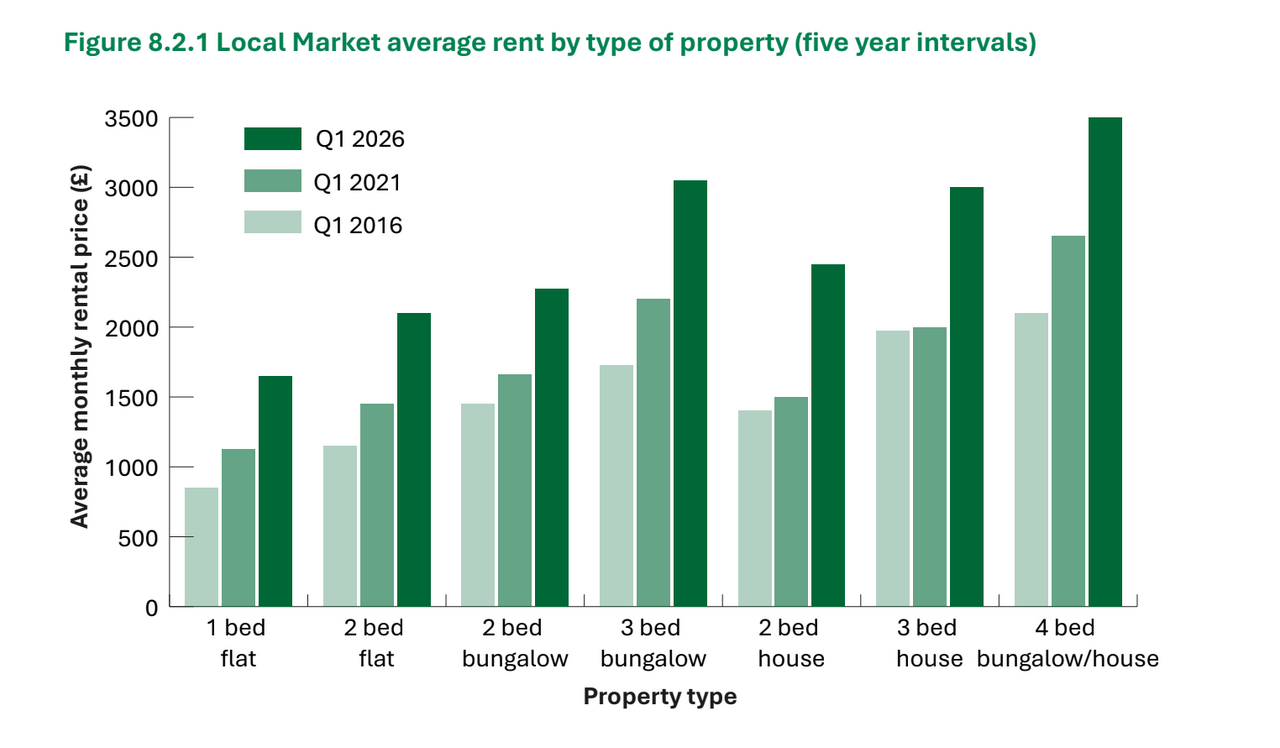
The rental market continued its upward trajectory, with the mix-adjusted average rental price reaching £2,170 per calendar month in Q1 2026, a 0.4% quarterly increase and 4.9% annual rise. Over five years, rental prices have surged by 44.9%, from £1,498 in Q1 2021.
The annual percentage change in rental prices exceeded the Retail Prices Index inflation measure, though by a narrower margin than in previous quarters.
The bulletin notes that several newly completed one-bedroom apartments were advertised at the upper end of the price range during recent quarters, which had a noticeable effect on median rental prices due to the high weighting of this category and relatively small sample sizes.
Average monthly rental prices by property type in Q1 2026 showed significant increases across all categories compared to five years earlier, with one-bedroom apartments, two-bedroom apartments, bungalows and houses, three-bedroom properties, and four-bedroom properties all demonstrating substantial growth. The bulletin notes these prices are based on relatively small sample sizes and are susceptible to fluctuations due to changes in the mix of size, quality, or location of advertised properties.
The most recent comparative data available from Q3 2024 showed an annual rent to earnings ratio of 0.55, representing a 2.5% annual increase, and a purchase price to earnings ratio of 14.1, representing an 8.7% annual decrease. The declining purchase price-to-earnings ratio suggests improving affordability for buyers, though the purchase price remains approximately 14 times annual median earnings. The rent-to-earnings ratio indicates that annual rent represents 55% of median annual earnings.
The ratio of purchase price to annual rent stood at 23.4 in Q1 2026, representing a 4.3% annual decrease. This ratio has declined significantly from 28.6 in Q1 2021, indicating that purchase prices have not kept pace with rental price growth. The declining ratio may make property purchase relatively more attractive compared to renting.
The Open Market segment, which comprises properties available to non-residents, showed greater volatility. The raw median realty price for the 28 Open Market transactions in Q1 2026 was £1,494,188, down from £1,913,438 in Q1 2025 but slightly higher than £1,404,272 in Q1 2021.
The four-quarter average Open Market price was £1,619,109 in Q1 2026, representing a 12.2% annual decrease but a 29.4% increase over five years. Open Market transaction volumes of 28 in Q1 2026 represented 1.9% turnover of all Open Market (Part A) property units, up from 1.1% in Q1 2025.
The bulletin emphasises that care must be taken when interpreting Open Market trends due to the very wide-ranging types and prices of properties and small number of transactions.
The island's domestic property stock showed modest net growth during Q1 2026, with 61 units classified as created and 16 units classified as removed, resulting in a net gain of 45 units.
Over the past year, 178 units were created whilst 66 were removed, resulting in a cumulative net increase of 112 units. This compares to annual net increases of 72 units in the year ending Q4 2024 and 94 units in the year ending Q4 2023.
Created units include new builds, subdivisions of existing units, and conversions from non-domestic to domestic use. Removed units include demolitions, amalgamations, and conversions to non-domestic use.
For Q1 2026, the annual percentage change in property purchase prices (4.1%) was slightly higher than the annual percentage change in the Retail Prices Index, representing a shift from much of 2024 and early 2025, when property price changes lagged behind retail price inflation. Rental price increases also exceeded retail price inflation in Q1 2026, continuing a long-term trend.
The bulletin uses a mix-adjusted average methodology that weights property transactions according to type and number of bedrooms to reflect the profile of the island's owner-occupied and buy-to-let property stock.
This approach, introduced in Q4 2011 and available from Q4 2008 onwards, is much less susceptible to changes in the profile of properties purchased from one quarter to the next compared to median average prices.
Seven property categories are used in calculations: one- and two-bedroom apartments, two- and three-bedroom houses, two- and three-bedroom bungalows, and four-bedroom houses and bungalows combined. The measure includes both realty and personalty, better reflecting actual prices paid.
Rental data has been collected since 2010 from web and classified advertisements and is now provided by local IT company Cortex Technologies Limited, which developed an automated system for collection.
Analysis of time on market by property type shows that for Q1 2026, advertised Open Market properties that sold had been on the market longer on average than advertised Local Market properties, continuing a five-year trend. For Local Market properties, houses and bungalows purchased were on the market for less time on average than apartments, representing a change from Q1 2025.
The bulletin provides extensive historical context, noting that the mix-adjusted average has fluctuated significantly since 2008, with notable periods including steady growth from 2016 through 2019, acceleration during the pandemic period peaking at £638,267 in Q4 2022, subsequent decline through 2023–2025 reaching a low of £580,412 in Q1 2025, and the recent recovery.
Annual Local Market transaction volumes have varied considerably, from 539 in 2015 to a peak of 984 in 2021, a low of 576 in 2023, and 816 in 2025. Rental prices have shown more consistent growth than purchase prices, with the mix-adjusted average rising from approximately £1,000 per month in 2016 to £2,170 in Q1 2026.
The data reveals consistent seasonal patterns in transaction volumes, with Q1 typically showing lower activity than later quarters, particularly Q2 and Q3.
The bulletin is produced quarterly by the States of Guernsey Data and Analysis team and is part of a suite of property-related publications available at gov.gg/property.
Q&A
Q: What is the current average property price in Guernsey?
A: The mix-adjusted average purchase price for Local Market properties reached £604,094 in Q1 2026, representing a 1.4% quarterly increase and 4.1% annual rise. This marks a return to growth after declining prices throughout much of 2024 and 2025.
Q: How long does it take to sell a property in Guernsey now?
A: The four-quarter rolling average time between a Local Market property becoming available for purchase and its subsequent sale extended to 284 days for properties purchased in Q1 2026, compared with 251 days in Q1 2025 and 207 days in Q1 2021.
Q: What are average rental prices in Guernsey?
A: The mix-adjusted average rental price reached £2,170 per calendar month in Q1 2026, a 0.4% quarterly increase and 4.9% annual rise. Over five years, rental prices have surged by 44.9%, from £1,498 in Q1 2021.


Comments ()