
Guernsey inflation rises to 4.3% as fuel and housing costs drive price increases
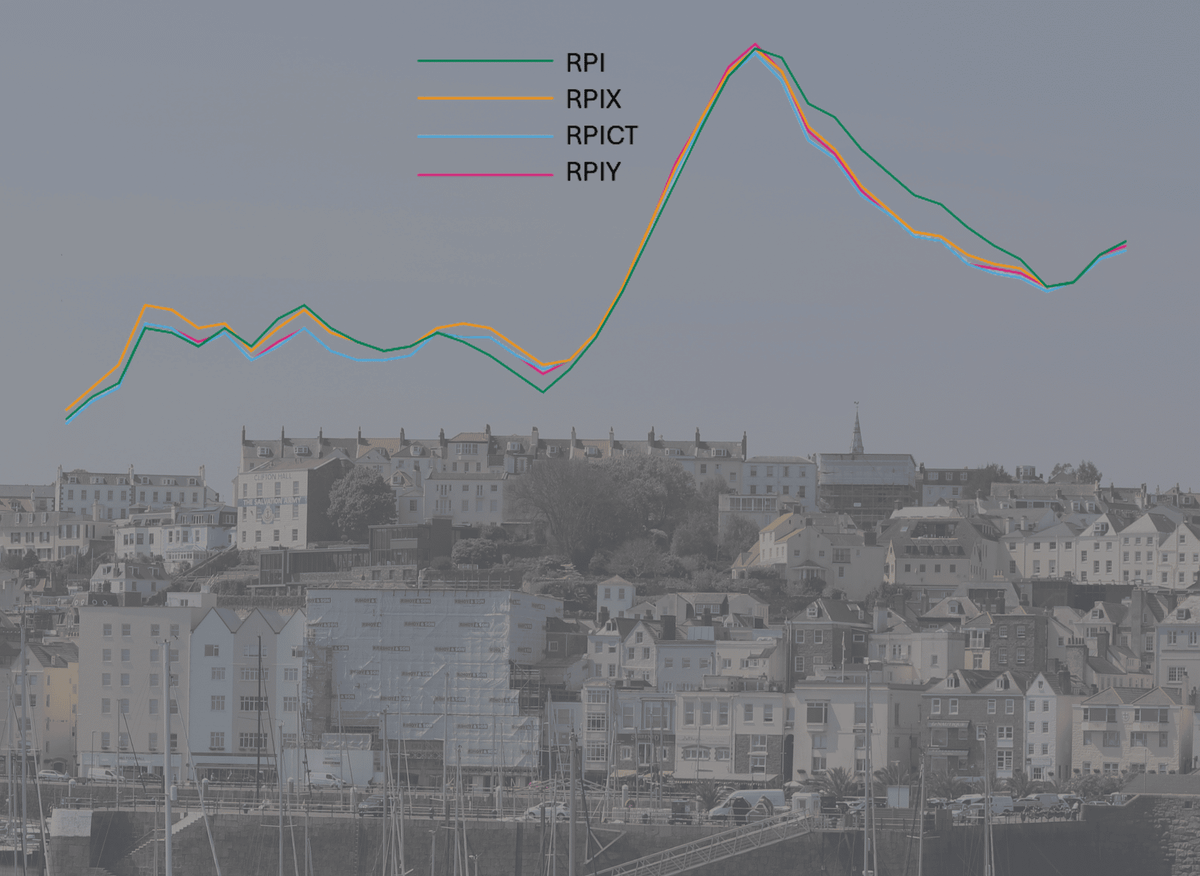
- Guernsey's inflation rate rose to 4.3% for the year ending June 2026, up from 3.9% in June 2025, reversing the downward trend since the December 2022 peak of 8.5%
- Fuel and light costs were the largest contributor, rising 19.0% annually driven by kerosene prices, adding 1.0 percentage point to overall inflation
- Housing costs contributed 0.9 percentage points to annual inflation with a 4.9% increase, driven by mortgage interest payments and home insurance premiums
- Retired households experienced the highest inflation impact at 5.2%, whilst mortgage holders and high income households saw the lowest at 4.0%
- The cumulative effect since June 2021 means £100 then is now worth approximately £131, representing a reflation factor of 1.31
Guernsey's inflation rate has climbed to 4.3% for the year ending June 2026, marking a reversal of the downward trend seen since peak levels in late 2022, according to the latest figures from the States of Guernsey.
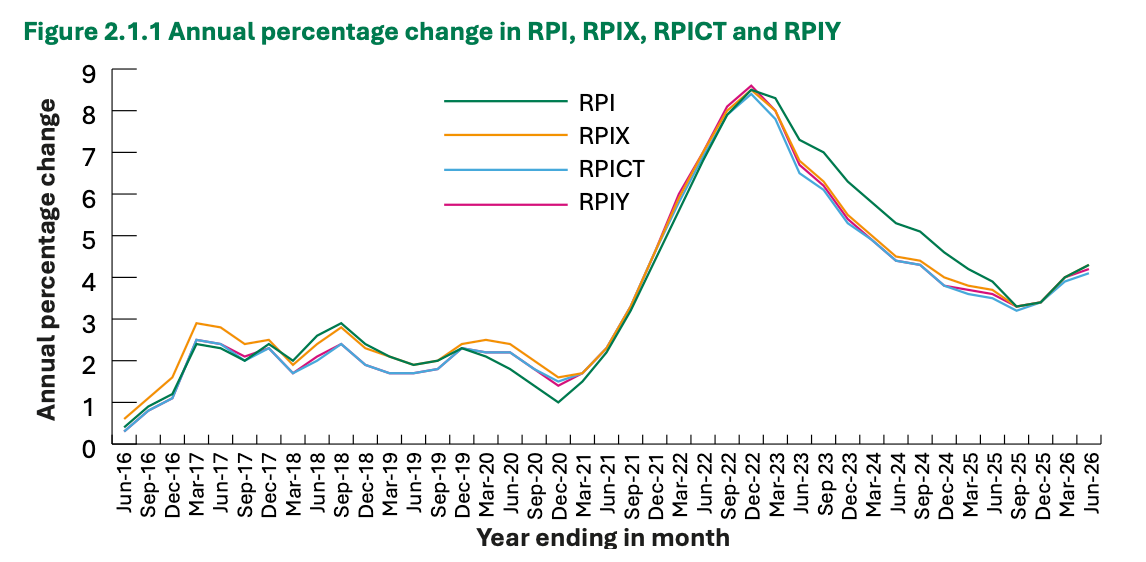
The all items Retail Prices Index (RPI) inflation of 4.3% represents a 0.4 percentage point increase from June 2025, when it stood at 3.9%, and is 0.3 points higher than the March 2026 figure of 4.0%.
The core inflation measure, RPIX, which excludes mortgage interest payments, also reached 4.3% for the year ending June 2026, up 0.6 percentage points from June 2025's 3.7% and 0.3 points higher than March 2026. Alternative measures RPICT and RPIY, which exclude various combinations of mortgage interest and indirect taxes, recorded annual inflation of 4.1% and 4.2% respectively.
All four RPI measures showed a 1.0% increase for the quarter ending June 2026, compared to 0.7–0.8% in the quarter ending June 2025 and 2.1–2.3% in the quarter ending March 2026.
The fuel and light group was the largest single contributor to annual inflation, adding 1.0 percentage point to the overall RPI change. This group recorded the highest overall price increase at 19.0%, driven primarily by kerosene prices. Quarterly, this category increased by 2.7%.
Housing costs contributed 0.9 percentage points to annual RPI change, with the group increasing by 4.9% annually on the RPI measure and 5.0% on RPIX, RPICT and RPIY measures. The increases were driven by mortgage interest payments and home insurance premium rises. The quarterly increase was 1.0% for RPI and between 0.7% and 0.8% for other measures.
Motoring expenditure saw annual increases of 5.6% on RPI, RPIX and RPICT measures, and 5.2% on RPIY, contributing 0.5–0.6 percentage points to annual change. The quarterly increase of 2.4–2.6% was mainly driven by petrol and diesel price increases early in the quarter, with additional impacts from vehicle insurance, spare parts and motorcycle purchase costs.
The tobacco group recorded a major price increase of 11.7% annually, mainly due to new excise rates. However, due to the relatively small weight of tobacco in the overall basket, it contributed just 0.1 percentage points to the overall annual change. Quarterly increases ranged from 0.8% to 3.5% depending on the measure used.
The catering group saw annual increases of 6.3%, with a quarterly rise of 0.6%, contributing 0.2 percentage points to annual change.
Household services increased by 3.4% annually, affected by changes to pet insurance, home contents insurance, postal services and communication services. The quarterly increase was 1.0%, contributing 0.4–0.5 percentage points to annual inflation.
Food prices rose 3.2% annually with a modest 0.1% quarterly increase. The figures reflected mixed changes, with fruits, dairy and meats increasing whilst tea, coffee and fruit squashes decreased. The food group contributed 0.4 percentage points to annual inflation.
Personal goods and services increased 4.3% annually and 0.8% quarterly, driven by increases in luggage, nappies and doctors' and dentists' visits. This group contributed 0.4 percentage points to the annual change.
Fares and other travel costs rose 3.5% annually and 0.8% quarterly, with increases in car hire, rail fares including Eurostar, and air fares, offset partially by reductions in sea fares and bicycle purchases. The contribution to annual inflation was 0.1 percentage points.
Alcoholic drink prices increased 3.0% annually on most RPI measures and 2.4% on RPIY, with quarterly increases of 1.0–1.3%. Increases in bottled cider, red wine, spirits and pub cider were partially offset by reductions in lagers and sparkling wines due to special offers.
Leisure services rose 2.0% annually and 1.1% quarterly, with package holiday prices and Channel Islands accommodation costs both increasing. The contribution to annual inflation was 0.2 percentage points.
Leisure goods saw a 2.5% quarterly increase, with rises in computer game consoles, smart speakers and musical instruments, whilst televisions, sports equipment and craft kits decreased in price.
Household goods increased 2.2% annually but just 0.1% quarterly. The group saw mixed changes with increases in aluminium foil, glassware, vacuum cleaners and pet food, whilst electric razors, towels and baby furniture decreased.
Clothing and footwear was the only major category to show an annual decrease, falling 0.8% over the year and 1.6% over the quarter. The figures reflect the high volatility in this category due to regular sales and special offers, with increases in girls' leggings, children's jumpers and men's jeans offset by decreases in children's tops, women's rainwear and trousers.
The Household Cost Indices, which measure inflation for different household types using a methodology designed to give equal household representation, increased by between 4.0% and 5.2% over the year ending June 2026, with an overall average of 4.6%.
Households containing one or more retired persons experienced the highest inflation impact at 5.2%, some 0.6 percentage points above the overall average. For these households, staple goods and services increased 6.9%, contributing 4.0 percentage points to their overall inflation rate, whilst additional goods and services increased 2.9%, contributing 1.3 percentage points.
Low income households, owner occupier households without mortgages, and households with one or more disabled persons all experienced inflation of 5.1%.
At the other end of the scale, owner occupied households with a mortgage and high income households both experienced the lowest inflation impact at 4.0%, some 0.6 percentage points below the overall average. For high income households, staple goods and services increased 5.8% whilst additional goods and services rose 2.2%. For mortgage holders, staple goods and services increased 5.3% and additional goods and services rose 2.3%.
Other household types saw inflation of 4.2% for households with children, 4.3% for households with no children and households with no retired persons, 4.4% for private renter households, and 4.5% for households with no disabled persons and social renter and partial owner households.
The latest figures show inflation has been rising after a sustained period of decline from peak levels. Annual RPI inflation reached 8.5% in December 2022 before declining steadily through 2023 and into 2025. June 2025 marked a low point at 3.9% before the recent uptick, meaning current levels of 4.3% represent a clear reversal of the downward trend.
The cumulative effect of inflation since June 2021 means that £100 in June 2021 now equals approximately £131 in June 2026 on the RPI measure, representing a reflation factor of 1.31. On the RPIX measure, £100 in June 2021 equals approximately £129 in June 2026, a reflation factor of 1.29.
The indices are based on approximately 2,000 goods and services across 14 groups, with calculations involving nearly 600 individual item indices. Weights are derived from the 2018–19 Household Expenditure Survey, though a new survey was conducted in 2023–24 with results published in July 2026. Updated weights are due to be applied in January 2027.
The "formula effect", which measures the difference between Dutot and Jevons calculation methods, was 0.2 percentage points for both RPI and RPIX annual changes and 0.1 percentage points for quarterly changes in June 2026. This indicates the Jevons method would have produced slightly lower percentage changes.
The next inflation bulletin for September 2026 will be published at 9:30am on Tuesday, 27th October 2026.
Q&A
Q: What is Guernsey's current inflation rate?
A: Guernsey's all items RPI inflation stands at 4.3% for the year ending June 2026, up from 3.9% in June 2025 and 4.0% in March 2026. This represents a reversal of the downward trend seen since the peak of 8.5% in December 2022.
Q: Which household types are most affected by inflation?
A: Households containing one or more retired persons experienced the highest inflation impact at 5.2%, followed by low income households, owner occupiers without mortgages, and households with disabled persons at 5.1%. Owner occupiers with mortgages and high income households saw the lowest impact at 4.0%.
Q: What are the main factors driving inflation in Guernsey?
A: Fuel and light costs are the largest contributor, rising 19% annually and adding 1.0 percentage point to overall inflation. Housing costs contributed 0.9 percentage points with a 4.9% increase, whilst motoring expenditure added 0.5-0.6 percentage points with increases of 5.6%. Tobacco prices rose 11.7% and catering costs increased 6.3%.



Comments ()