
Guernsey inflation rises to 4.0% as heating fuel costs soar and low-income households face highest price increases
- Guernsey's inflation rate rose to 4.0% for the year ending March 2026, up 0.6 percentage points from December 2025 but down 0.2 points from March 2025
- Fuel and light prices soared 14.7% annually, the largest increase of any category, driven primarily by kerosene prices, whilst tobacco rose 12.4% following new excise rates
- Low-income households faced the highest inflation at 5.1%, whilst owner-occupiers with mortgages experienced the lowest at 3.6%, creating a 1.4 percentage point disparity
- Housing costs rose 4.7% annually, contributing 0.9 percentage points to overall inflation through increases in rents, water charges, Tax on Real Property and waste costs
- The quarterly inflation rate accelerated sharply to 2.1% in the three months to March 2026, compared to just 0.4% in the previous quarter
Guernsey's inflation rate has risen to 4.0% for the year ending March 2026, marking a 0.6 percentage point increase from December 2025, according to the latest quarterly bulletin from the States of Guernsey Data and Analysis Service.
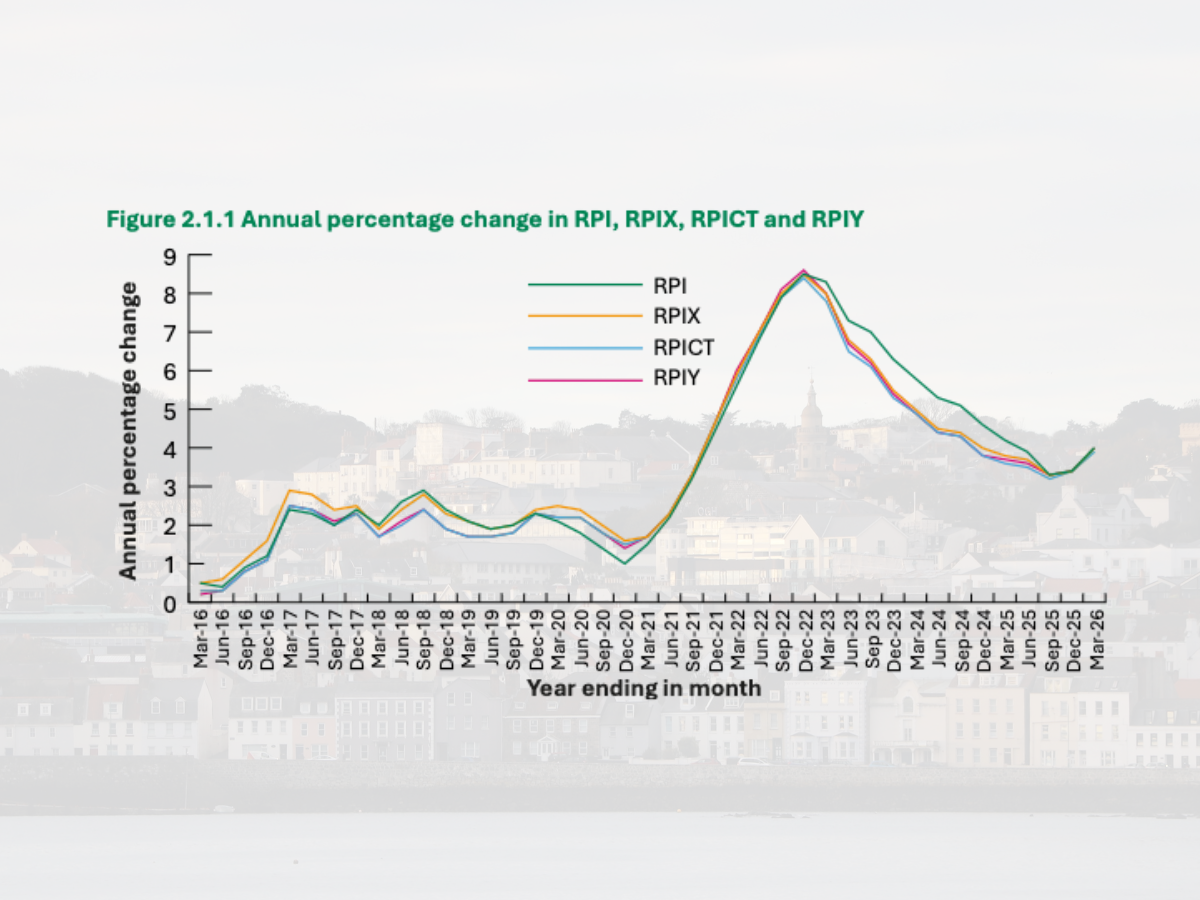
The "all items" Retail Prices Index (RPI) inflation rate of 4.0% represents a slight decrease of 0.2 percentage points from March 2025, when it stood at 4.2%. However, the quarterly change shows a more pronounced acceleration, with the RPI increasing 2.1% in the three months to March 2026, compared to 0.4% in the quarter ending December 2025.
Core inflation, measured by the RPIX which excludes mortgage interest payments, stood at 4.0% for the year ending March 2026, up 0.2 percentage points from March 2025 and 0.6 points higher than December 2025. The RPIX rose 2.3% quarterly, up from 1.6% in March 2025 and 0.3% in December 2025.
Fuel and light prices emerged as the largest driver of inflation, recording a 14.7% annual increase and contributing 0.8 percentage points to the overall RPI.
Key terms
The quarterly increase in this category was 9.6%, contributing 0.5 percentage points to the quarterly RPI change. Kerosene prices were identified as the driver of the fuel and light increase, while electricity, gas and coal prices remained unchanged in the latest quarter.
Tobacco prices rose 12.4% annually, following the introduction of new excise rates which became effective during the quarter. The quarterly increase was 9.2% for RPI and RPIX measures. Alcohol prices also increased, driven by changes in excise duty implemented during the quarter, with the alcoholic drink group rising 1.6% quarterly.
Catering prices increased 6.3% annually, with a 2.0% quarterly rise driven by increases in take-away coffees, take-away ethnic food and restaurant main courses. Food prices rose 5.2% annually and 2.1% quarterly, with increases across various sweets and chocolates, ice creams, sauces and some meat and fish, whilst strawberries, cakes and other meats saw decreases.
The housing group contributed significantly to inflation, rising 4.7% annually for the RPI and contributing 0.9 percentage points to the annual RPI change. The quarterly increase was 2.5% for RPI, though this rose to 3.8% for RPIX and RPICT measures. Increases were recorded across rents from the Guernsey Housing Association, States of Guernsey and private landlords, as well as water charges, Tax on Real Property, parish rates, waste costs and insurance premiums.
Household goods prices increased 2.0% quarterly, driven by rises in ink cartridges, household cleaning products, kitchen equipment, bedroom and living room furniture and laminate flooring. Some washing machines and electric cookers decreased due to special offers.
Clothing and footwear prices rose 2.6% in the quarter, with increases in shoes, women's jumpers and men's shirts, though the bulletin notes that prices in this group are volatile with regular sales and special offers.
Motoring expenditure increased 1.6% quarterly for RPI and RPIX, driven mainly by petrol and diesel price increases, alongside rises in new and second-hand cars and motorcycles, spare parts and roadside recovery services.
Fares and other travel costs decreased 0.7% quarterly, with air fares and car hire charges falling, though sea ferry fares, rail fares including Eurostar, and boat and bicycle purchases increased.
The bulletin reveals significant disparities in inflation experienced by different household types through Household Cost Indices (HCIs). Low-income households experienced the highest inflation at 5.1%, which is 0.7 percentage points above the overall average HCI of 4.4%. For these households, staple goods and services increased 5.4% on average, contributing 3.5 percentage points to the total increase, whilst additional goods and services increased 4.4%, contributing 1.5 percentage points.
Owner-occupied households with mortgages experienced the lowest inflation at 3.6%, which is 0.7 percentage points below the overall average. Staple goods and services for these households increased 4.3%, whilst additional goods and services increased 2.7%.
Other household categories showed varying inflation rates. High-income households experienced 3.7% inflation, whilst households with children faced 4.0% and those without children 4.1%. Households with retired persons experienced 5.0% inflation compared to 4.1% for households without retired persons. Households with disabled persons faced 4.9% inflation against 4.3% for those without disabled persons.
Tenure-based variations showed owner-occupier households without mortgages at 4.8%, private renter households at 4.5% and social renter and partial owner households at 4.6%.
The bulletin notes that "the biggest range was seen in the indices for households with different income levels this quarter, whereas last quarter the biggest range was seen across different tenures." The 1.4 percentage point gap between low-income and high-income households represents a significant disparity in inflation experience.
The bulletin provides historical context showing that inflation peaked in December 2022 at 8.5% for both RPI and RPIX. March 2023 recorded RPI at 8.3% and RPIX at 8.0%. Since then, there has been a steady decrease through 2023 and 2024, with March 2024 showing RPI at 5.8% and RPIX at 5.0%, and December 2024 at RPI 4.6% and RPIX 4.0%.
After reaching a recent low of 3.3% for RPI in September 2025, inflation has increased modestly, with the current rate of 4.0% representing a stabilisation with a slight uptick.
The bulletin addresses the erosion of purchasing power through cumulative percentage changes and reflation factors. Over five years from March 2021 to March 2026, the RPI cumulative change was 31.2%, with a reflation factor of 1.31. This means £100 in March 2021 equals approximately £131 in March 2026 purchasing power. Over one year from March 2025 to March 2026, the RPI cumulative change was 4.0%, with a reflation factor of 1.04.
The bulletin explains: "The effect of inflation is to erode the purchasing power of currency."
The indices are based on a shopping basket containing over 1,800 items, with nearly 600 individual item indices calculated each quarter based on approximately 2,000 goods and services. Current weights are derived from the 2018-19 Household Expenditure Survey, though a new survey was conducted in 2023-24.
The bulletin distinguishes between different index types. The RPI measures overall average inflation for households in Guernsey. The RPIX excludes mortgage interest payments, which are directly affected by Bank of England base rate changes. The RPIY excludes mortgage interest payments and indirect taxes, whilst the RPICT excludes mortgage interest payments and the effect of changes to indirect taxes.
The bulletin explains: "The RPICT and RPIY both exclude the elements of inflation that can be directly influenced by government, but in slightly different ways." For March 2026, RPICT stood at 3.9% and RPIY at 4.0%.
The HCIs differ from RPIs in two key ways. Weights are calculated using a different method to give lower spending households equal representation with higher spending households. Average price changes are calculated using the Jevons method, also used in Jersey RPI and UK CPI, rather than the Dutot method used in Guernsey RPIs.
The bulletin notes that the Jevons method "assumes that some people modify what they buy to a certain extent when faced with large price increases," making it better suited for comparing inflation impacts across different household types.
The bulletin advises: "The HCIs are designed to show how inflation rates for particular types of households compare with each other and with the overall average. They are intended to be compared with each other but not with the RPIs, due to methodological differences."
For March 2026, the formula effect—the difference between using the Dutot method versus the Jevons method—was minimal. The annual RPI showed 0.0 percentage points difference, whilst the quarterly RPI showed 0.1 percentage points difference, indicating the methods produced similar results for this period.
The States of Guernsey Data and Analysis Service provides an online inflation calculator at www.gov.gg/rpi for calculating percentage changes between any two quarters from 1949 onwards, along with supplementary and historical inflation data spreadsheets with reflation factors from 1949 for RPI and 1999 for RPIX. An inflation hotline is available on 01481 227012.
The next bulletin is provisionally scheduled for publication at 9:30am on Tuesday 28 July 2026, covering June 2026 data.
Q&A
Q: What is the current inflation rate in Guernsey?
A: The 'all items' RPI inflation rate is 4.0% for the year ending March 2026. This represents a 0.2 percentage point decrease from March 2025 but a 0.6 percentage point increase from December 2025.
Q: Which household types are most affected by inflation?
A: Low-income households experience the highest inflation at 5.1%, which is 0.7 percentage points above the overall average. Owner-occupied households with mortgages experience the lowest inflation at 3.6%. Households with retired persons face 5.0% inflation, whilst those with disabled persons face 4.9%.
Q: What are the main drivers of price increases?
A: Fuel and light prices show the largest annual increase at 14.7%, driven primarily by kerosene prices. Tobacco prices rose 12.4% following new excise rates, catering increased 6.3%, food rose 5.2%, and housing costs increased 4.7%. The housing group contributed 0.9 percentage points to the annual RPI change, whilst fuel and light contributed 0.8 percentage points.


Comments ()