
Guernsey housing data highlights escalating affordability challenges for lower earners as markets diverge

Guernsey's rental and purchase markets are showing signs of significant divergence.
While Local Market rental costs continue to rise and place immense pressure on lower-income households in particular, the purchase market shows signs of cooling, marked by lower average prices, increased transaction volumes, and greater negotiating room for buyers.
The Quarry has analysed the freshly released Q3 Quarterly Residential Property Prices Bulletin together with the latest available earnings and poverty data to present a picture of housing affordability over the last decade which starkly emphasises the structural difficulties faced by lower earners that is missed when concentrating on headline averages alone.
This analysis reinforces the need for social and affordable housing solutions already identified and being acted on by the States.
But there are limitations in this research, partly relating to the States inability to currently produce up-to-date population, employment and earnings figures.
The trajectory of the rental market
The Local Market rental sector remains a principal source of upward pressure on housing costs. In the third quarter of 2025, the mix adjusted average property rental price reached £2,112 per calendar month.
While the annual rate of increase has slowed compared to previous high-inflation quarters, growth remains positive:
- The Q3 2025 average rent was 2.8% higher than the third quarter of 2024.
- Over the five years ending Q2 2025, the mix adjusted average price increased by 50.8%.
- Looking back ten years, the mix adjusted average price increased by 67.6%.
This sustained rental inflation contrasts sharply with wage growth. Median earnings of employees (four-quarter average to March 2024) decreased by 0.2% in real terms over that year, when adjusted for price inflation.
Affordability: structural barriers for lower earners
The most challenging aspect of the rental market is its near-mathematical impossibility for individuals relying solely on lower-quartile wages.
The annual cost of the average Local Market rent is £25,344, based on £2,112 per month.
Comparing this annual cost against the latest available lower quartile annual earnings (representing the bottom 25% of earners in a sector, as of March 2024):
- An individual earning the lower quartile wage in accommodation and food service activities (£22,059) would require 114.9% of their gross employment income to cover the average rent.
- For those in wholesale and retail trade (£20,046), the burden rises to 126.4% of gross income.
These figures illustrate that single individuals in these sectors cannot afford average market rent without supplementary income, sharing accommodation, or receiving social welfare support.
But there are limitations to the data.
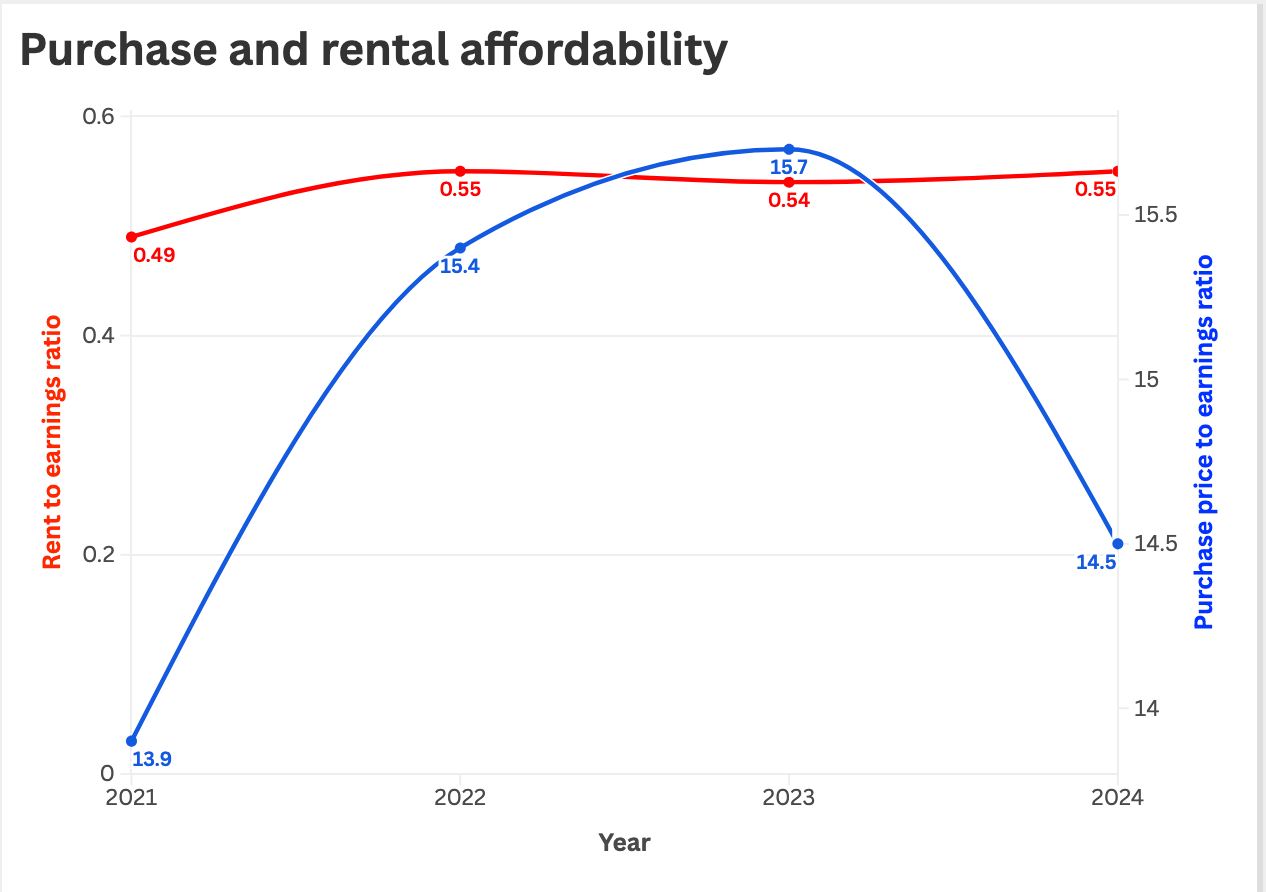
It is important to note that the official Purchase Price to Earnings and Annual Rent to Earnings ratios have not yet been updated in the Q3 2025 bulletin, as earnings data for the most recent period is unavailable.
Furthermore, these standard ratios compare housing costs only to annualised earnings from employment (median earnings), and so exclude critical factors like social benefits, total household income, and multiple earners, which are necessary to understand the actual disposable income of low-income households.
The cooling property purchase market in Q3 2025
In contrast to the rental sector, the Local Market purchase segment has experienced a reduction in average price and is displaying indicators of a slowdown.
Price and Annual Change
- The mix adjusted average purchase price for Local Market properties in Q3 2025 was £592,584.
- This represents an annual decrease of 2.8% compared to Q3 2024.
- The purchase price was also 0.7% lower than the previous quarter (Q2 2025).
- The four-quarter average mix adjusted purchase price remained 27.3% higher than five years previously.
Market activity and speed
Transaction volumes increased modestly in Q3 2025:
- There were 209 Local Market transactions, an increase of 44 compared to Q3 2024.
- The four-quarter rolling average time between a property being advertised and its sale completion was 265 days. This is a notable increase from 221 days recorded in Q3 2024, indicating properties are taking longer to sell.
Buyer Leverage
Increased buyer leverage is evident in the negotiation gap:
- The final sale price was, on average, 7.3% lower than the maximum advertised price in Q3 2025. This negotiation margin is slightly higher than the 7.2% recorded a year prior and significantly higher than the 5.4% gap recorded in Q3 2020.
Open Market
The raw median purchase price (realty only) for the 22 Open Market transactions recorded in Q3 2025 was £1,852,500.
This raw median price is subject to more fluctuation than the mix adjusted local market price. The Open Market four quarter average price increased by 5.2% over the year ending Q3 2025.
The mix adjusted average purchase price includes both realty and personalty. This measure is designed to reduce quarterly volatility but remains susceptible to fluctuations due to changes in the size, quality, and location of properties sold in any given quarter.
Due to relatively small sample sizes, these variations cannot be entirely eliminated.
The purchase price is a measure of the value of properties sold, not a reflection of the change in value of any single property over time.
Baseline poverty and the impact of housing costs
The Household Income Estimates Report for 2022, the latest available, provides context by measuring income deprivation after housing costs are deducted. This data, while lagged, establishes a baseline against which the Q3 2025 rental pressures can be measured.
Real-term income decline
Between 2017 and 2022, the median gross unequivalised household income increased by 5.3% in nominal terms but decreased by 10.0% in real terms. The mean gross unequivalised household income also decreased by 10.3% in real terms over the same period.
Income deprivation (relative poverty)
In 2022, the median equivalised disposable income (net of social security, income tax, and imputed housing costs) was £37,197.
- 23% of households and 19% of people were classified as income deprived, having an income below 60% of this median (£22,318).
- Housing costs represented the largest single deduction from gross equivalised household income in both 2017 (17%) and 2022 (15%), exceeding both income tax (12% in 2022) and social security contributions (5% in 2022).
Deprivation by tenure
The HIR highlights that households in specific tenures faced disproportionately high rates of poverty in 2022:
- 47% of households living in Affordable housing were below the 60% median income threshold.
- 44% of households living in Privately Rented accommodation were below this threshold.
- By contrast, 14% of owner-occupier households without a mortgage and 12% of those with a mortgage were below the threshold.
Lagged data context
The HIR 2022 poverty assessment precedes the most severe recent rental inflation.
- In Q3 2022, the average monthly rent was £1,726.
- By Q3 2025, the average monthly rent had climbed to £2,112.
This 22.4% increase in average rent since the poverty baseline was measured suggests that the proportion of households in privately rented accommodation experiencing income deprivation (44% in 2022) is likely significantly higher under the current financial strain.
Housing supply and planning pipeline

The continuing high demand for non-market housing persists, reflected in the waiting list figures:
- As of December 2024, 384 households were registered on the combined social rental housing waiting list.
- Affordable residential property units constitute 10.2% of all Local Market residential property units.
The housing supply pipeline, monitored against the required minimum two-year supply for meeting the Strategic Housing Indicator, shows sufficient units planned, though construction completion rates remain modest:
- At the end of 2024, there were 929 units in the pipeline supply (with full or outline planning permission). This number exceeds the required two-year pipeline supply of 536 to 654 new units.
- In 2024, the net increase in residential units was 98 units (including new builds, subdivisions, and conversions, minus demolitions and amalgamations).
The caveats
It is essential to understand this analysis within the limitations inherent in the source data:
- Experimental income methodology: The Household Income Report relies on an experimental methodology developed in 2024, using machine learning to fill data gaps. This method is viewed as superior to previous approaches but is likely to be refined in the coming years. Full income data was available for only 58% of the people included in the 2022 analysis.
- Estimation of housing costs: The housing costs deducted in that report to determine disposable income are estimated based on tenure and property size, as the actual cost paid by individual households is not known. Furthermore, owner-occupiers without a mortgage have no housing cost deducted.
- Small sample sizes: Measures for both the mix adjusted average purchase price and the mix adjusted average rental price are susceptible to fluctuation because they are based on relatively small sample sizes, meaning variations in the size, quality, and location of properties sold or advertised each quarter cannot be completely eliminated.
- Median earnings distortion: The latest available median earnings figures (March 2024) may have been artificially inflated in prior years (e.g., 2020 and 2021) due to the loss of a disproportionate number of lower-paid roles during the COVID-19 period. This can affect the perceived severity of the purchase and rent to earnings ratios.


Comments ()