
Do you have to spend big to get elected? The data suggests not
Ahead of this year’s General Election there was significant debate about spending limits.
But can you spend your way to power?
And does where you direct your cash matter?
You can explore the data below to help draw your own conclusions.
The background to current spending limits
Towards the end of last term, States members were presented with proposals for candidates to be able to spend up to £7,500 and parties up to £15,000, up from the 2020 election.
Ultimately they decided on a reduction instead, lowering the limit for individual candidates from £6,000 to £3,000 and the limit for political parties from £9,000 to £3,000.
The argument was that this would create a more level playing field, especially for candidates who had limited spending power.
A £500 grant that had been available was scrapped.
The average spend in 2020 was around £2,200.
What happened in 2025 and what were the concerns?
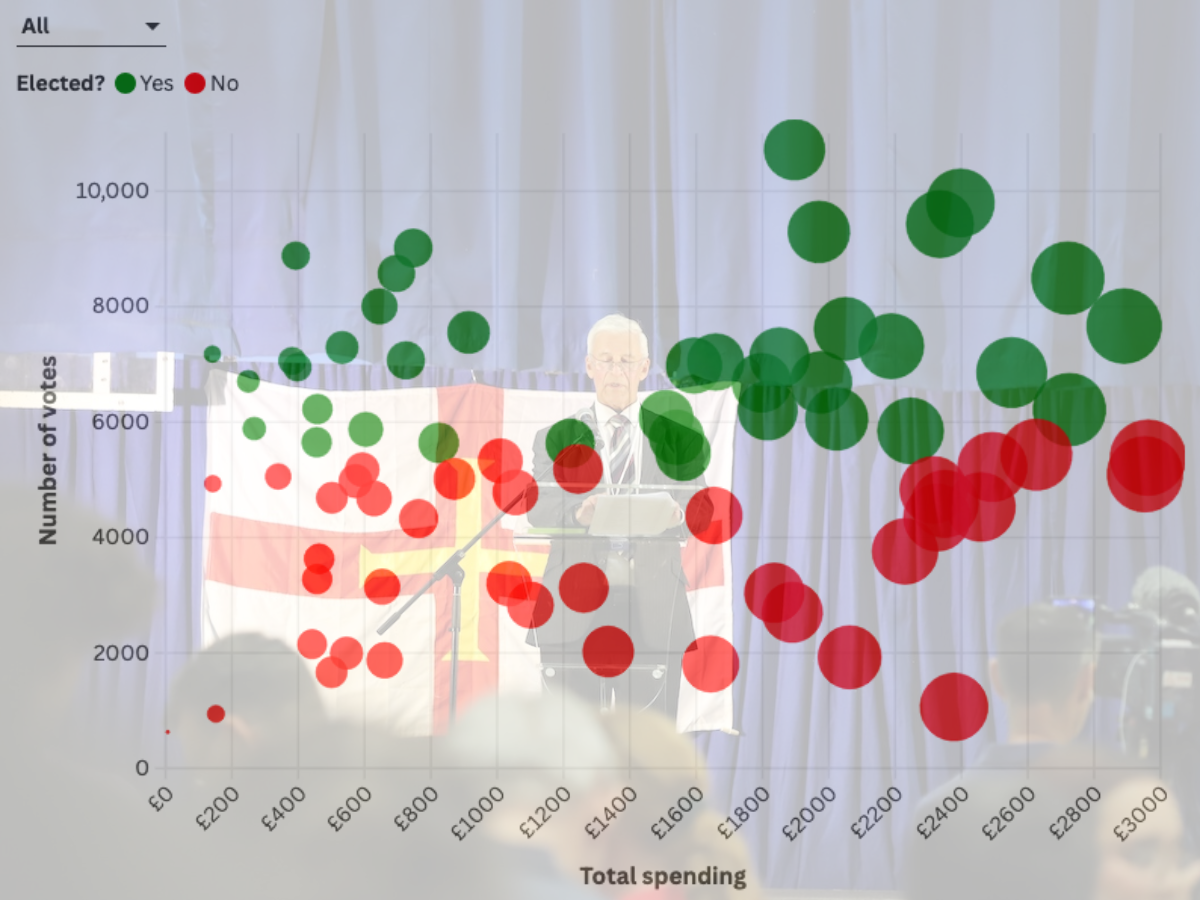
Hover over the charts to see all the names
Ultimately, individual candidates spent a total of £103,461.16 on the 2025 election, according to declared spending data published for the first time to improve transparency.
The average spend, at £1,261.72 is actually down significantly on the previous island-wide vote.
Three candidates, Sofi Noakes, Ross Le Brun and Luke Graham have failed to file a declaration, which were due within 45 days of the vote under the Reform Law.
There appears to have been no consequence to that.
In the evaluation of the 2025 vote, some candidates were still arguing that the limits were too low.
According to a report by the The Commonwealth Parliamentary Association British Islands and Mediterranean Region, candidates stated that the £3,000 limit precluded them being able to print and distribute their own individual manifestos or materials to each household across the island.
Candidates also noted it limited their ability to purchase media advertising, which was important given the island-wide system, and also served to increase their reliance on the government for their campaign.
There were also concerns about the interplay of party politics and think tank spending.
Does spend matter?
There are clearly many factors that go into whether a candidate is elected or not.
But exposure and being able to get your message across is one of them.
It should be noted that all candidates had access to free campaign material in the States’ election manifesto booklet and on its website, and the booklet was cited in the previous election as being relied on by a vast majority of voters.
It’s noticeable that the two biggest spendings in the election, David Nussbaumer (£2,962.09) and John Dyke (£2,953.83) both failed to get elected.
Of those spending above average, 21 out of the 38 of them got elected.
Dive into the top 10 spenders, five of them failed to win a seat, spending upwards of £2,458.
Looking at the spendthrifts, Deputy Andy Cameron was the lowest spending of the successful candidates, with an outlay of just £141.
From the bottom 10 spenders, excluding those who we have no declaration for, four of them won a seat.
Of those spending less than £400, five won election.
Money, it seems, is not everything.
Where did candidates put their money?
Of their total spending, £18,596.93 went on advertising, which includes on social media, TV, radio, in print and online - a category of concern for those who want bigger budgets which is why it is highlighted first here.
Deputy John Gollop was the biggest spender in this area, £2,295 of his total of £2,552.03 (90%) and finished in 22.
Next up in financial terms was Deputy Yvonne Burford, who directed 57% of her £2,335.20 spend in this category and was second in the polls, followed by Deputy Andy Sloan (£997.31 out of £1508.77) who was 29th.
Noticeably only half the candidates directed any money in this area, 20 of them were elected.
The biggest spending category was print production, so things like posters, flyers, leaflets, signs, manifestos and t-shirts.
A total of £40,059.71 of individual candidate’s spending went in this area.
But out of the top six spenders in this category, only Deputy Chris Blin got elected.
It does not, however, necessarily pay to ignore it as a strategy.
Take the bottom 15 spenders, who put in less than £61 here - 12 of them failed to win a seat.
Those who were the biggest spenders with creative agencies did not fare well.
The top nine spenders in this area, committing between £1,297 and £2,617.21, all failed to win a seat, for all of them it accounted for the majority of their spending, for three nearly 100%.
The party factor
Six of the candidates were members of Forward Guernsey, three won seats.
Each of them put £500 of their individual limit into the party coffers.
Forward Guernsey submitted its own expenditure declaration, spending a total of £2,786.48.
It concentrated that on print production (£1,357.50), with £594.10 going on advertising.
Questions have been raised with the CPA BIMR about the support the party received from an associated think tank.
“The Reform Law states that no money or money’s worth should be expended by a person other than a candidate with a view to promoting the election of a candidate. Transparency regarding third party support for a candidate or party is important.”
It should be noted that the regulated period for campaign spending started six weeks before the date when candidate nominations could be submitted.
Any amount can be spent outside this timeframe by anyone.
No one thing wins or loses an election.
You can filter the data by new candidates, incumbents and former deputies - all could play a factor in voters' minds depending on their legacies and what they were associated with.
Editors note: The text has been updated to reflect that five out of the top 10 spenders (excluding those that have not filed), not six as originally stated, got elected after a reader spotted an error in our spreadsheet reading. The Quarry is committed to correcting any mistakes openly and quickly.
Comments ()